
Miami Leads Nation in Home Price Appreciation in 2014
World Property Journal
by Michael Gerrety
According to the latest S&P/Case-Shiller Home Price Indices for October 2014, the pace of home prices across the country continues to decelerate although eight cities did see prices rise faster, with Miami leading the nation with a 9.5% annual appreciation rate in 2014.
Year-over-Year
Both the 10-City and 20-City Composites saw year-over-year declines in October compared to September. The 10-City Composite gained 4.4% year-over-year, down from 4.7% in September. The 20-City Composite gained 4.5% year-over-year, compared to 4.8% in September. The S&P/Case Shiller U.S. National Home Price Index, which covers all nine U.S. census divisions, recorded a 4.6% annual gain in October 2014 versus 4.8% in September.
Miami and San Francisco saw prices rise 9.5% and 9.1% over the last 12 months. Eight cities, including San Francisco, Denver, and Tampa saw prices rise faster in the year to October than a month earlier. Las Vegas led the declining annual returns with a decrease of -1.2%.
Month-over-Month
The National and Composite Indices were both slightly negative in October. Both the 10 and 20-City Composites reported a slight downturn, -0.1%, while the National Index posted a -0.2% change for the month. San Francisco and Tampa led all cities in October with increases of 0.8%. Chicago and Cleveland offset those gains by reporting decreases of -1.0% and -0.7% respectively.
October recorded mixed monthly figures. Ten cities recorded lower monthly figures while eight posted increases. Detroit and San Diego both reported flat monthly changes. San Francisco had the largest increase of all 20 cities at 0.8% month-over-month.
“After a long period when home prices rose, but at a slower pace with each passing month, we are seeing hints that prices could end 2014 on a strong note and accelerate into 2015,” says David M. Blitzer, Managing Director and Chairman of the Index Committee at S&P Dow Jones Indices. “Two months ago, all 20 cities were experiencing weakening annual price increases. Last month, 18 experienced weakness. This time, 12 cities had weaker annual price growth, but eight saw the pace of price gains pick up. Seasonally adjusted, all 20 cities had higher prices than a month ago.
“Most national economic statistics, other than those connected to housing, posted positive reports in November and early December. Third quarter GDP was revised to 5% real growth at annual rates, and unemployment was at 5.8% as payrolls added over 300,000 jobs in November. Housing was somber: housing starts pulled back 1.6%, existing home sales were at 4.93 million, down 6.1%, and new home sales were 438,000, down 1.6%, all in November.”
Chart 1 below depicts the annual returns of the U.S. National, the 10-City Composite and the 20-City Composite Home Price Indices. The S&P/Case-Shiller U.S. National Home Price Index, which covers all nine U.S. census divisions, recorded a 4.6% annual gain in October 2014. The 10- and 20-City Composites reported year-over-year increases of 4.4% and 4.5%.
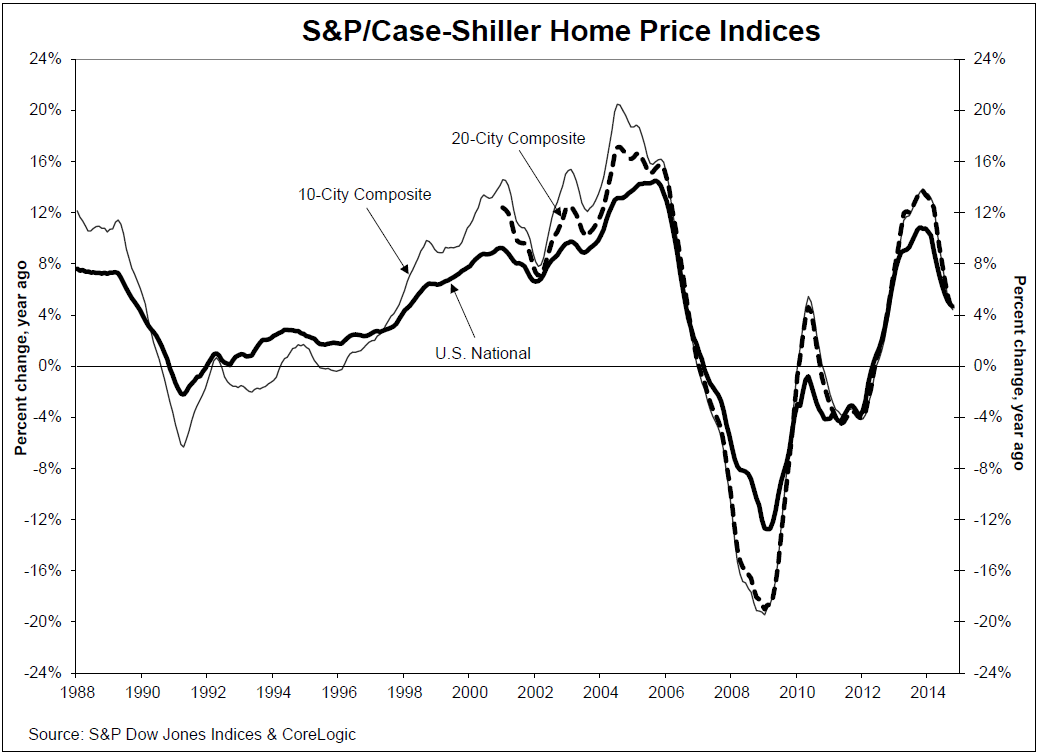
Chart 2 below shows the index levels for the U.S. National, 10-City and 20-City Composite Indices. As of October 2014, average home prices for the MSAs within the 10-City and 20-City Composites are back to their autumn 2004 levels. Measured from their June/July 2006 peaks, the peak-to-current decline for both Composites is approximately 16-17%. The recovery from the March 2012 lows is 28.5% and 29.3% for the 10-City and 20-City Composites.
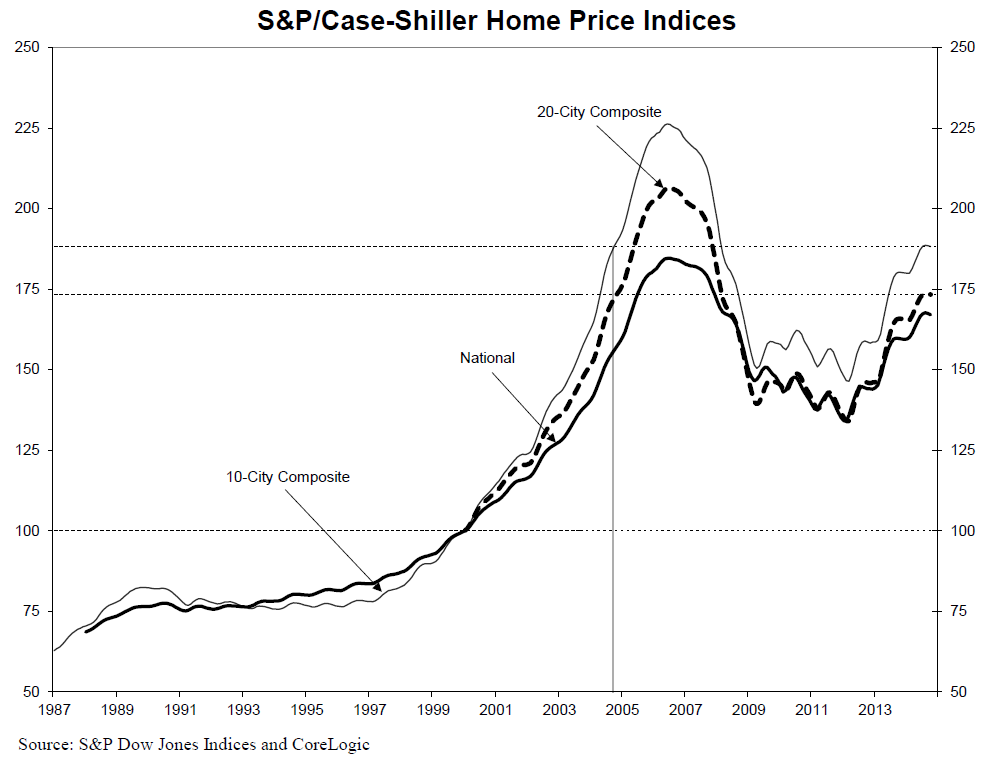
Table 1 below summarizes the results for October 2014. The S&P/Case-Shiller Home Price Indices are revised for the prior 24 months, based on the receipt of additional source data.
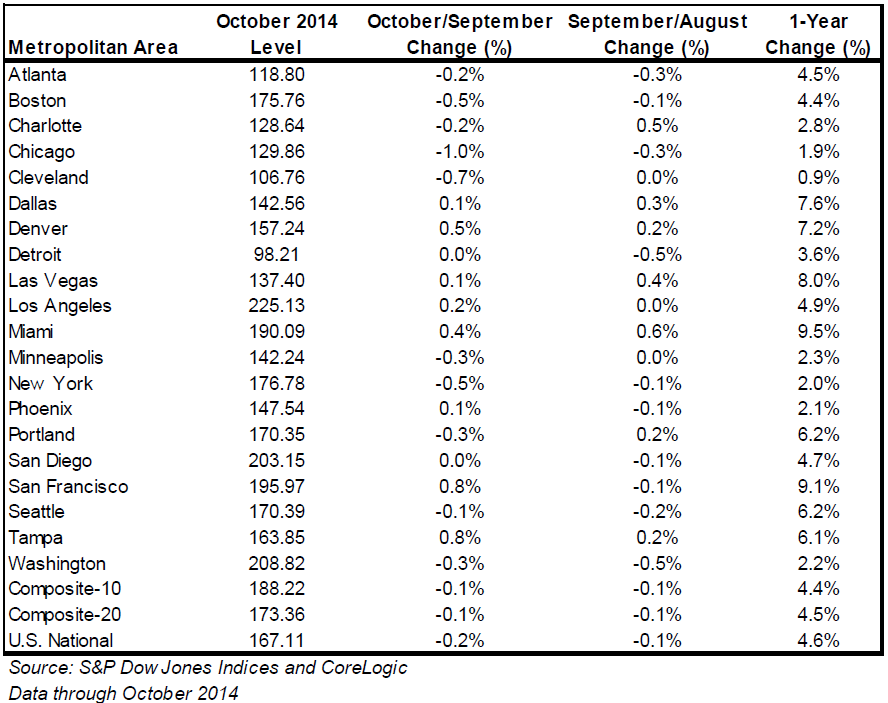
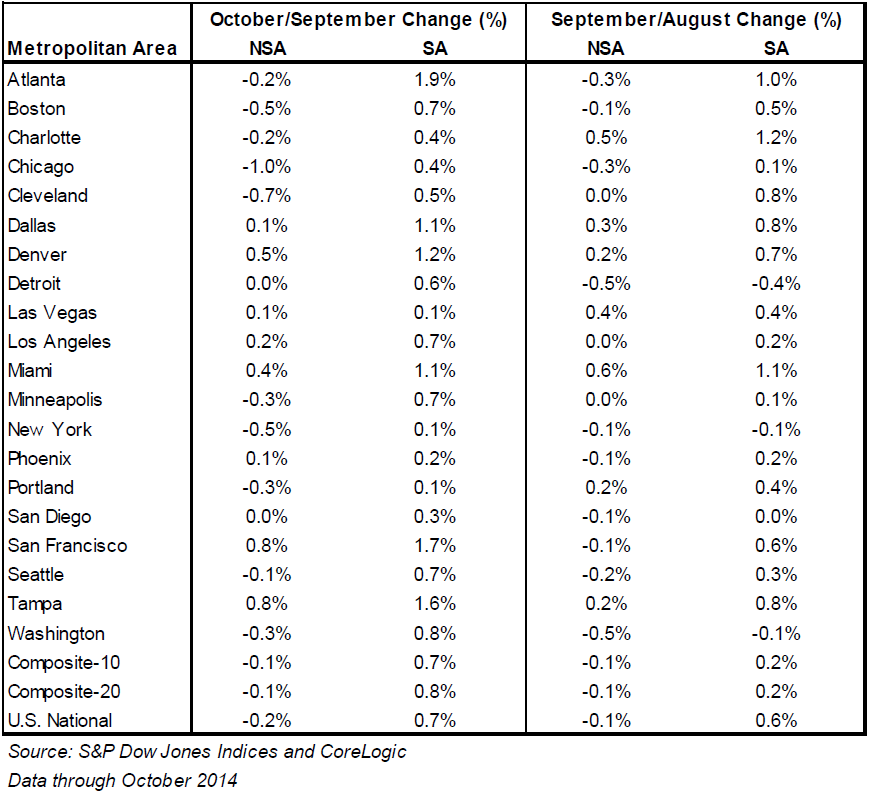
Table 2 below shows a summary of the monthly changes using the seasonally adjusted (SA) and non-seasonally adjusted (NSA) data. Since its launch in early 2006, the S&P/Case-Shiller Home Price Indices have published, and the markets have followed and reported on, the non-seasonally adjusted data set used in the headline indices. For analytical purposes, S&P Dow Jones Indices publishes a seasonally adjusted data set covered in the headline indices, as well as for the 17 of 20 markets with tiered price indices and the five condo markets that are tracked.
– See more at: http://www.worldpropertyjournal.com/real-estate-news/united-states/miami-real-estate-news/miami-home-prices-spcase-shiller-home-price-indices-for-october-2014-david-blitzer-home-price-appreciation-in-2014-los-angeles-home-prices-san-francisco-home-prices-8762.php#sthash.pxng9yKK.dpuf
Back to Blog
-

UPS PICKS UP MIAMI DEVELOPMENT SITE FOR DISTRIBUTION WAREHOUSE: $31M
The Real Deal by Katherine Kallergis Prologis has sold a 43-acre development site west of Miami International Airport to UPS for $31 million. Records show UPS paid about $16 a foot for the property at 13200 Northwest 17th Street, which is slated to become a distribution warehouse. The land is approved for up to 5.3 […]
Read more -

DOUGLAS ELLIMAN RELEASES EXCLUSIVE 1ST QUARTER 2021 ELLIMAN REPORT FOR THE MIAMI, BOCA RATON, FORT LAUDERDALE, AND PALM BEACH MARKETS
It is with great pleasure that I share with you the just released first quarter 2021 “Elliman Reports” for the Florida sales markets, the leading resource on the state of these markets. Our market reports are produced in conjunction with Miller Samuel to provide you and your clients with the most comprehensive and objective market insight available. Boca Raton/Highland Beach’s brisk market conditions […]
Read more -
DOUGLAS ELLIMAN RELEASES EXCLUSIVE 4TH QUARTER 2020 ELLIMAN REPORT FOR THE MIAMI, BOCA RATON, FORT LAUDERDALE, AND PALM BEACH MARKETS
It is with great pleasure that I share with you the just released fourth quarter 2020 “Elliman Reports” for the Florida sales markets, the leading resource on the state of these markets. Our market reports are produced in conjunction with Miller Samuel to provide you and your clients with the most comprehensive and objective market insight available. Sales in Boca Raton/Highland Beach rose sharply higher […]
Read more -
DOUGLAS ELLIMAN RELEASES EXCLUSIVE 3RD QUARTER 2020 ELLIMAN REPORT FOR THE MIAMI, BOCA RATON, FORT LAUDERDALE, AND PALM BEACH MARKETS
It is with great pleasure that I share with you the just released third quarter 2020 “Elliman Reports” for the Florida sales markets, the leading resource on the state of these markets. Our market reports are produced in conjunction with Miller Samuel to provide you and your clients with the most comprehensive and objective market insight available. Sales in Boca Raton/Highland […]
Read more